Infographics are a BIG thing right now.
Some of them are better than others, but many people are enamored with infographics, no matter WHAT they are supposed to explain. We probably have social sites like Pinterest to thank for that.
 |
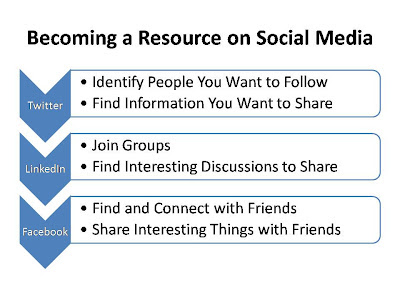
| Infographics, like this, seem to capture people's attention more than standard text. |
There are all sorts of infographics that people can make, and if they have MS PowerPoint 2007 (or possibly PowerPoint 2010--but I don't have that to know for sure), I am going to show that it's pretty easy.
Here is how you can create an infographic quickly and easily using MS PowerPoint 2007 (or a later version).
Here is the quick explanation without pictures. (More detailed step-by-step directions will follow.)
- Open MS PowerPoint 2007
- Select "Insert" on the Ribbon
- Select "SmartArt" on the Ribbon
- Select the Infographic style
- Complete text within Infographic
- Save Infographic as .jpg file type
- Insert Picture (which happens to be the Infographic)
 |
| Example #2: Infographic: Pictures hold readers' attention MUCH more easily than regular words do. |
If you need more help than THOSE directions gave, follow these instructions to create an infographic.
Step #1:Open MS PowerPoint 2007 (or later version)
Step #2 :Select Insert SmartArt function on the MS PowerPoint ribbon. (at the top).
 |
| Select "Insert" then select "SmartArt" on the MS PowerPoint ribbon. |
Step #3: Select which Infographic shape/style you prefer to use.
 |
| You are greeted with this pop-up box menu when you begin to Insert SmartArt (for your InfoGraphic). |
 |
| On the left side column, select which category of graphics you want to use (List, Process, Circle, etc.). |
 |
| Within the shape category, select which style you want to use for your InfoGraphic and Click "OK" |
Step #4: Complete the text information that you want your infographic to show.
 |
| Depending upon the shape and style you select, you will begin with something like this. Begin typing. |
 |
| Here is how this looks after you begin typing (notice the blue chevron on the left side AND the white boxes on the right). |
Step #5:Save the InfoGraphic as a jpeg (.jpg) file type.
 |
| Begin Saving the picture as you ordinarily would save a file. |
 |
| Select the "Save As" option on the left side column. |
 |
| Select "Other Formats" on the right side column. |
 |
| Click the down arrow beside "Save As Type" and choose "JPEG..." |
 |
| Click the "Save" button. |
 |
| Select "Current Slide Only" (CAUTION: This will NOT be the default.) |
Now, you've SAVED the infographic. All you need to do is insert this infographic, like you would any other picture.
Step #6: Insert the Picture (InfoGraphic) into your blog, presentation, etc.
 |
| Example: Completed InfoGraphic |
 |
| Another Example: Infograhpic |
That is ALL there is to making a fairly detailed infographic.
Let me know if you try and have trouble. Also, I'd like to see examples of infographics you make.
Like this post? Other recent posts are
- Small Business Tip: 4 Reasons It's So Hard to Delegate
- Small Business Tip: 3 Ways I Take Action for My Own Business--Not My Customer
- A Sneaky Internet Marketing Idea I've Never Tried
- 6 Steps a Small Business Owner Should Take to Have a Great Vacation
- 4 Ways I'd Market a Local Store Online to Get Found in Google
- Laugh and Learn Video: Over 7 Selling Things I Learned Watching Kenny Brooks
- Event Marketing Tip: 4 Reasons to Create a Video to Promote an Event
To visit The Ultimate Analyst company website click HERE.
Tweet

No comments:
Post a Comment
Hey there! Thank you for taking time to read my post and share your thoughts with me and my other readers. I'm always tickled when I get a non-SPAM comment. Honestly, sometimes I'm even okay with some borderline SPAM.
Let me know if you would like for me to address a topic by sending me an email at Chris@TheUltimateAnalyst.com.
Thanks, again. I look forward to seeing you soon.
Chris